
ChartBasic chart archive
Forex chart studies
A separate gallery for all 25 supplied TradingView screenshots. Open any chart for a larger view and its pair details.
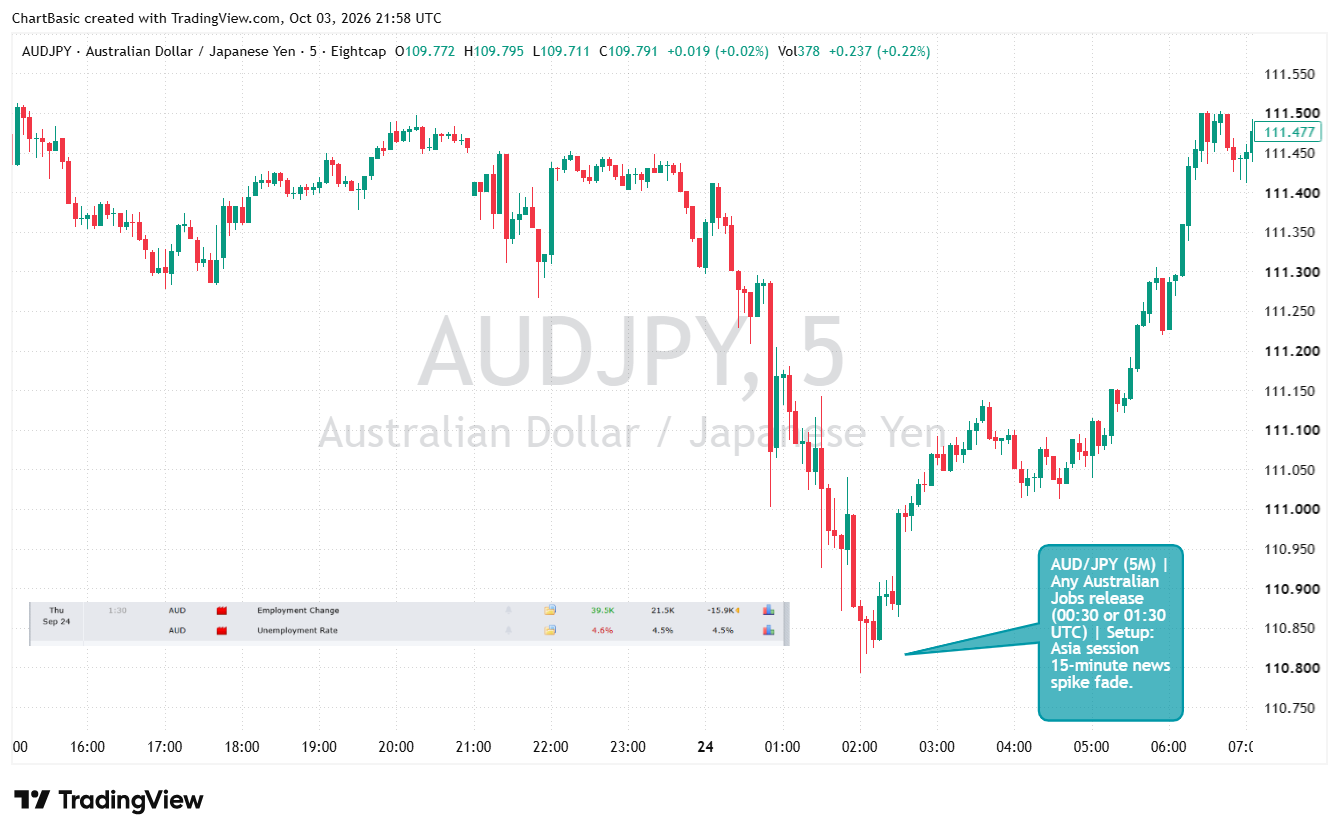
AUD/JPY chart study 01
Chart note · An Australian jobs-release spike fades during the Asia session on the 5-minute chart.
Open full chart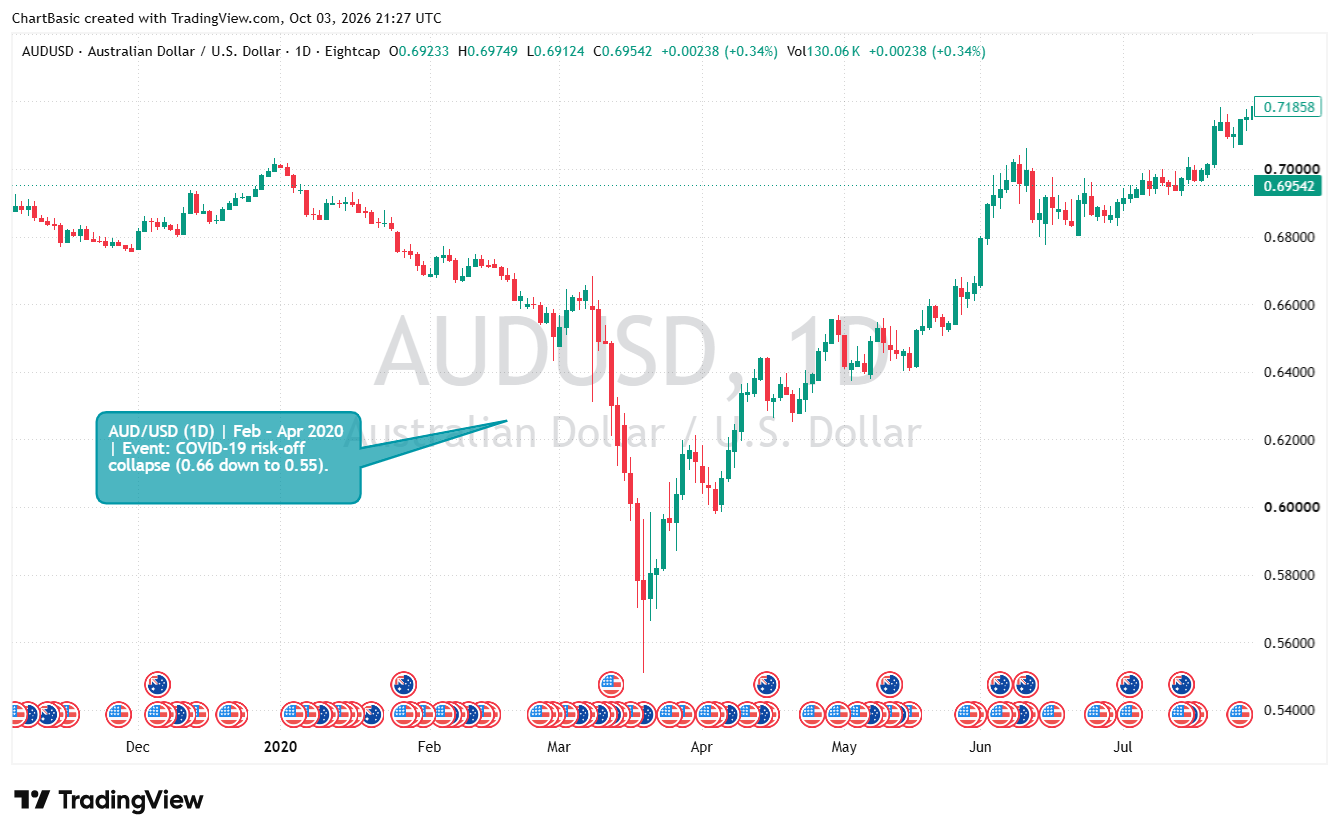
AUD/USD chart study 02
Chart note · The 2020 COVID risk-off shock drove AUD/USD from roughly 0.66 to 0.55 before recovery.
Open full chart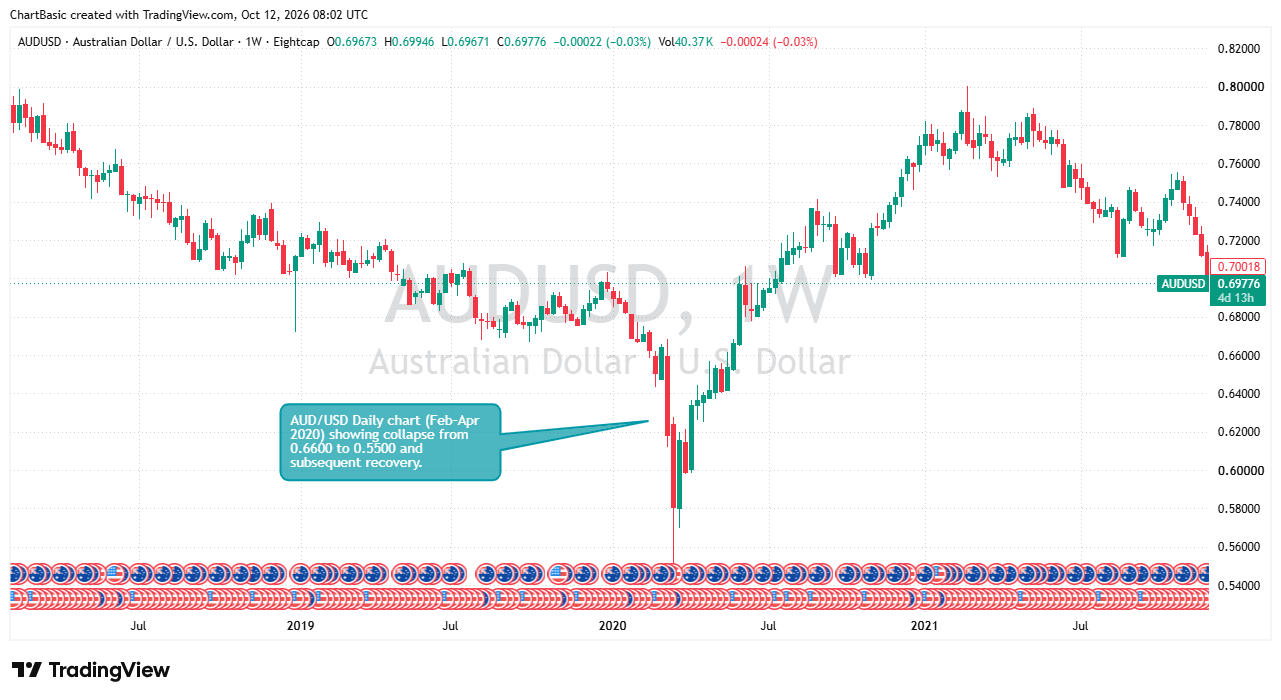
AUD/USD chart study 03
Chart note · Weekly AUD/USD candles show the 2020 pandemic selloff and the subsequent rebound.
Open full chart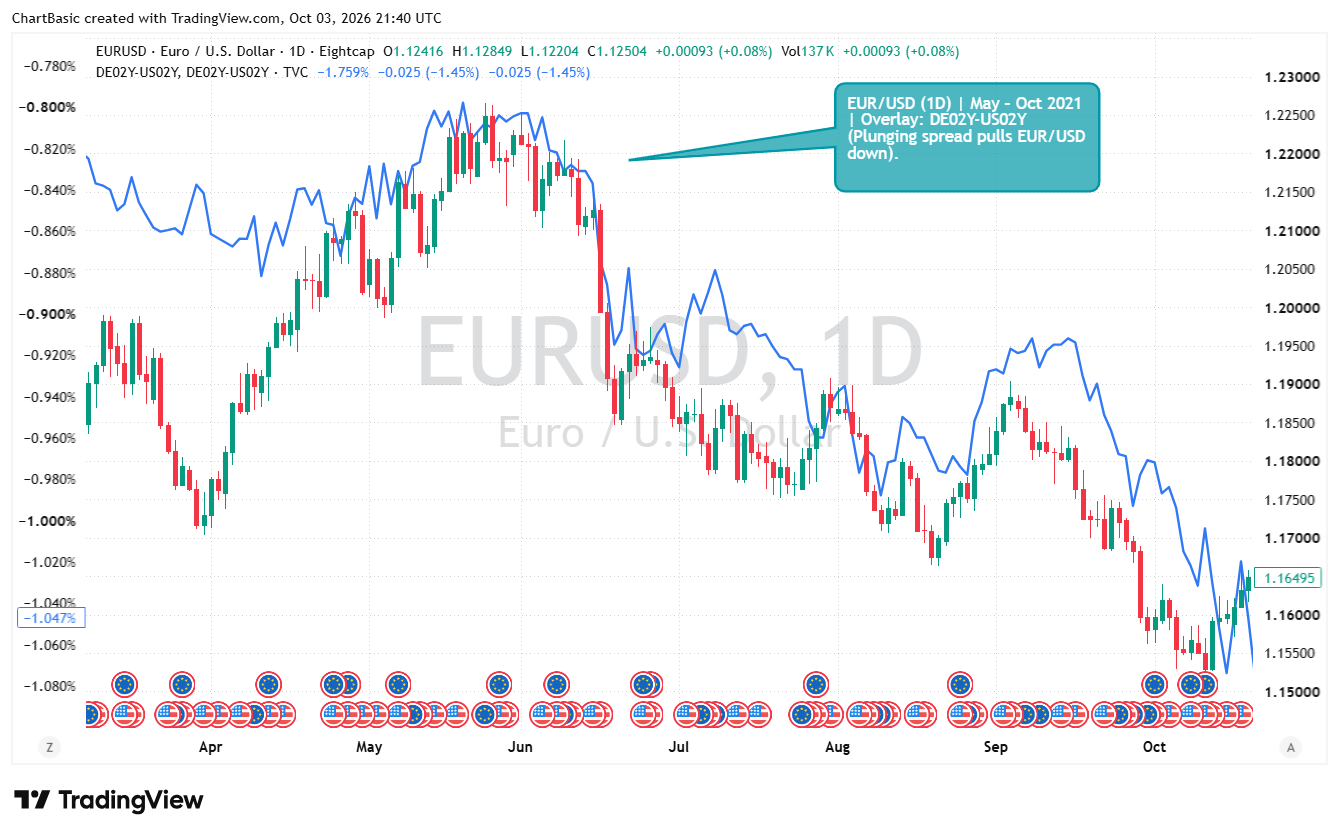
EUR/USD chart study 04
Chart note · A falling German–U.S. 2-year yield spread accompanied EUR/USD weakness from May to October 2021.
Open full chart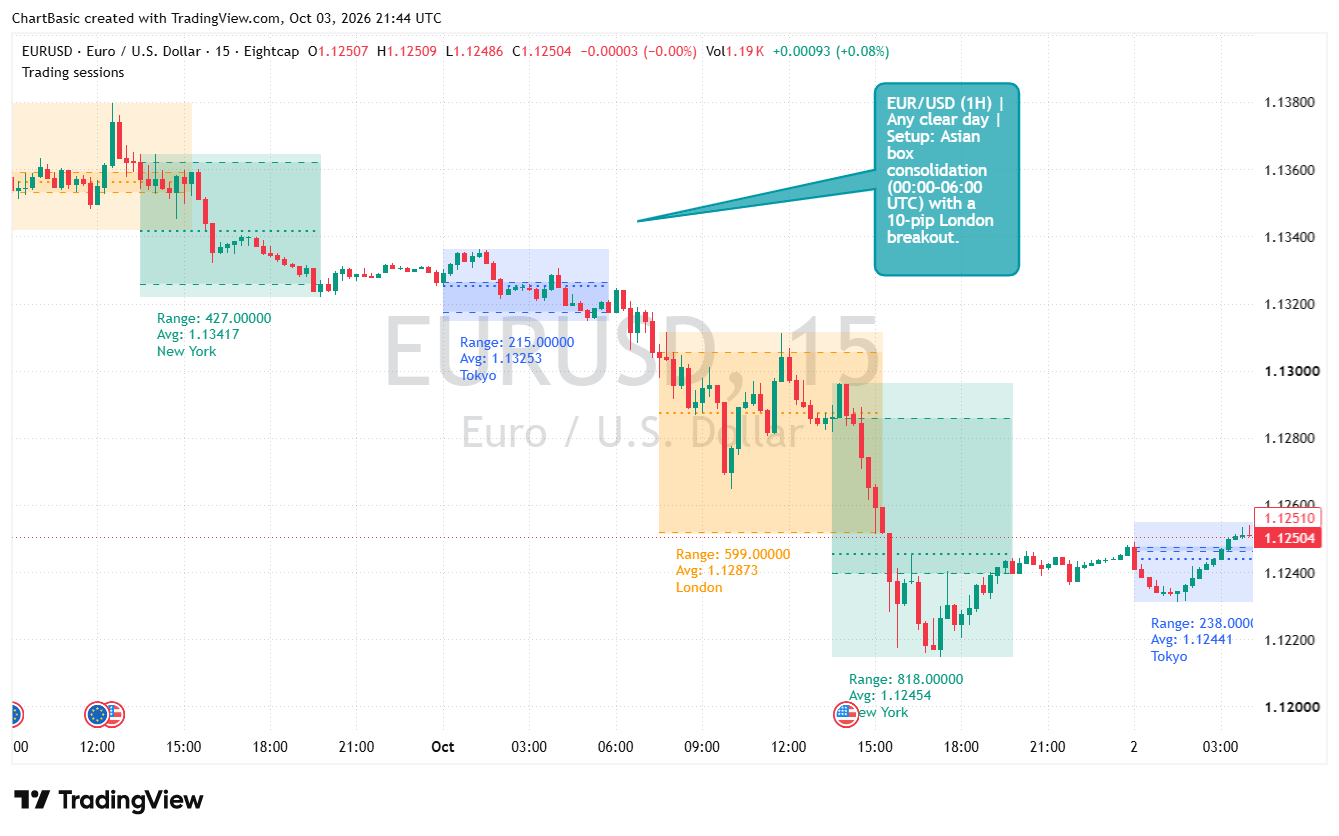
EUR/USD chart study 05
Chart note · Daily EUR/USD price is overlaid with the DE02Y–US02Y yield spread for May–October 2021.
Open full chart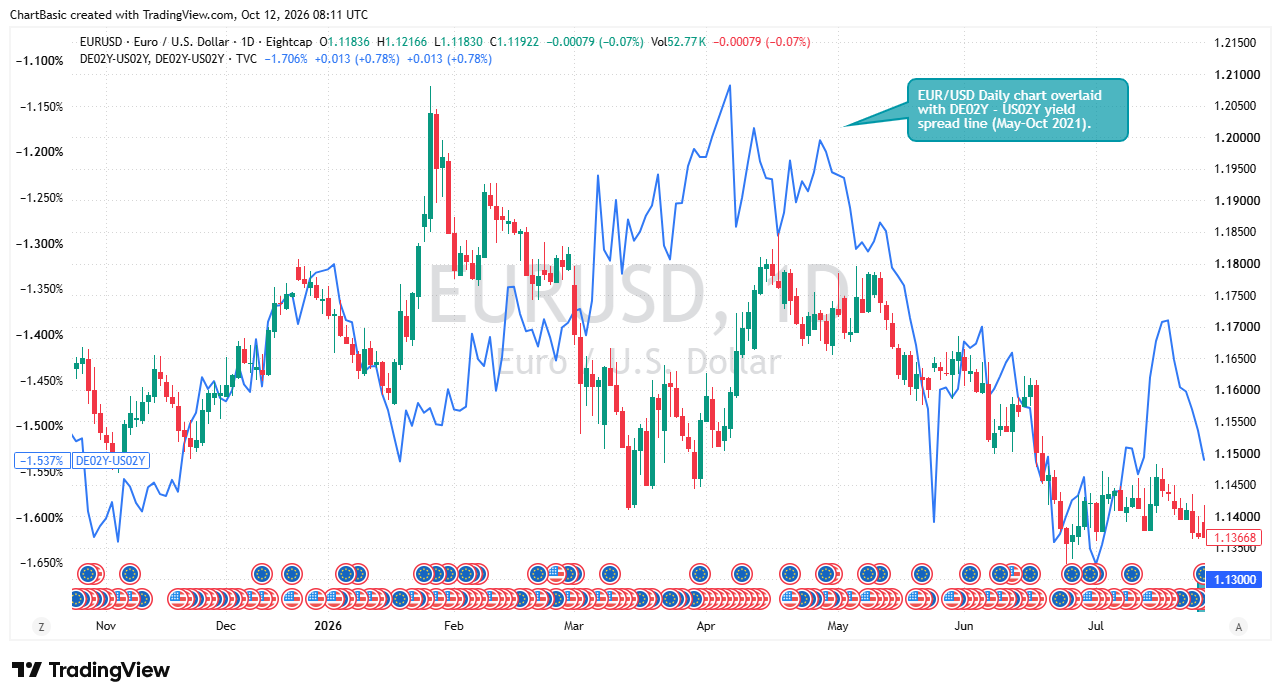
EUR/USD chart study 06
Chart note · An Asian-session range with a 10-pip buffer frames a London-session breakout setup.
Open full chart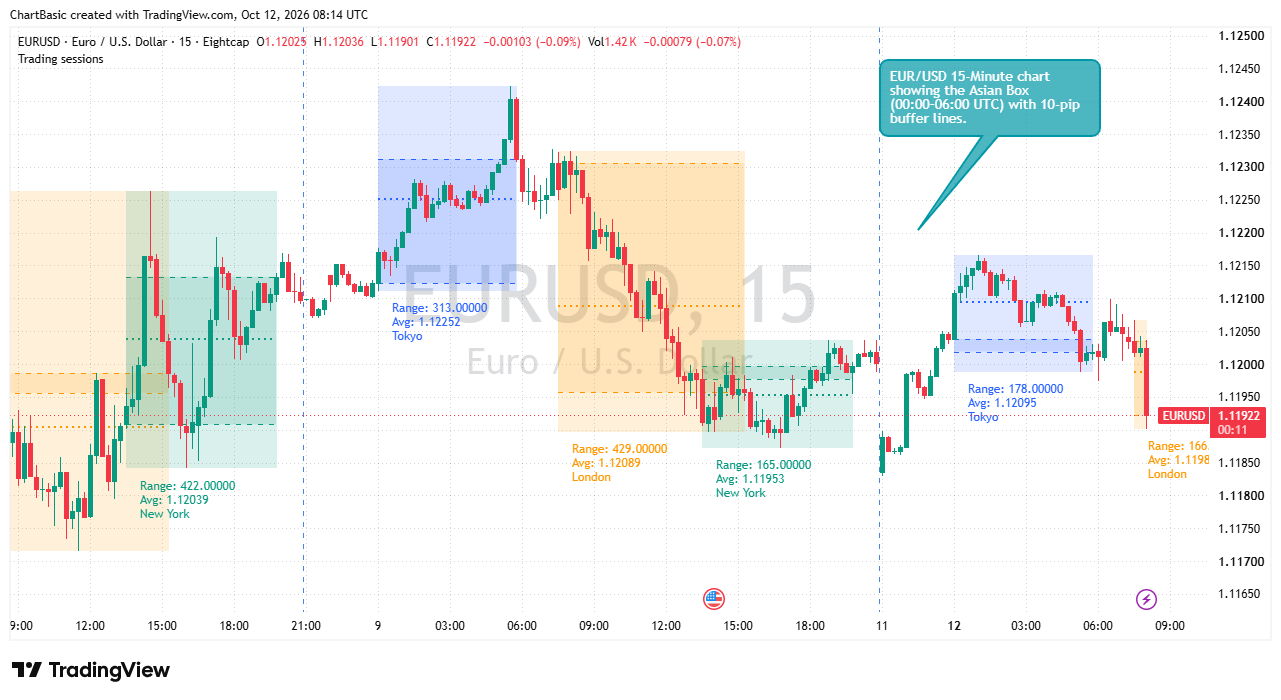
EUR/USD chart study 07
Chart note · A 15-minute EUR/USD chart marks the Asian box and its 10-pip buffer lines.
Open full chart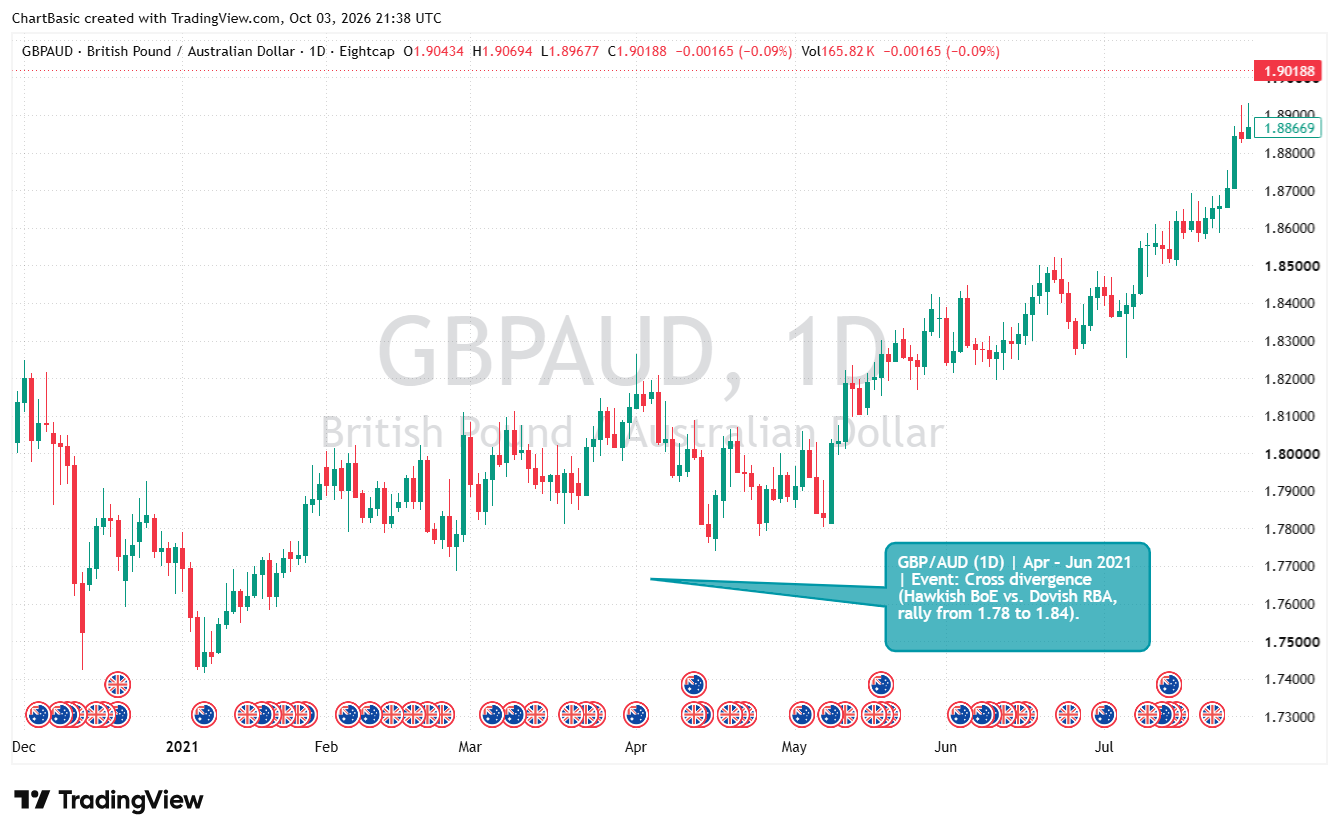
GBP/AUD chart study 08
Chart note · Hawkish Bank of England versus dovish RBA divergence coincided with a GBP/AUD rally in 2021.
Open full chart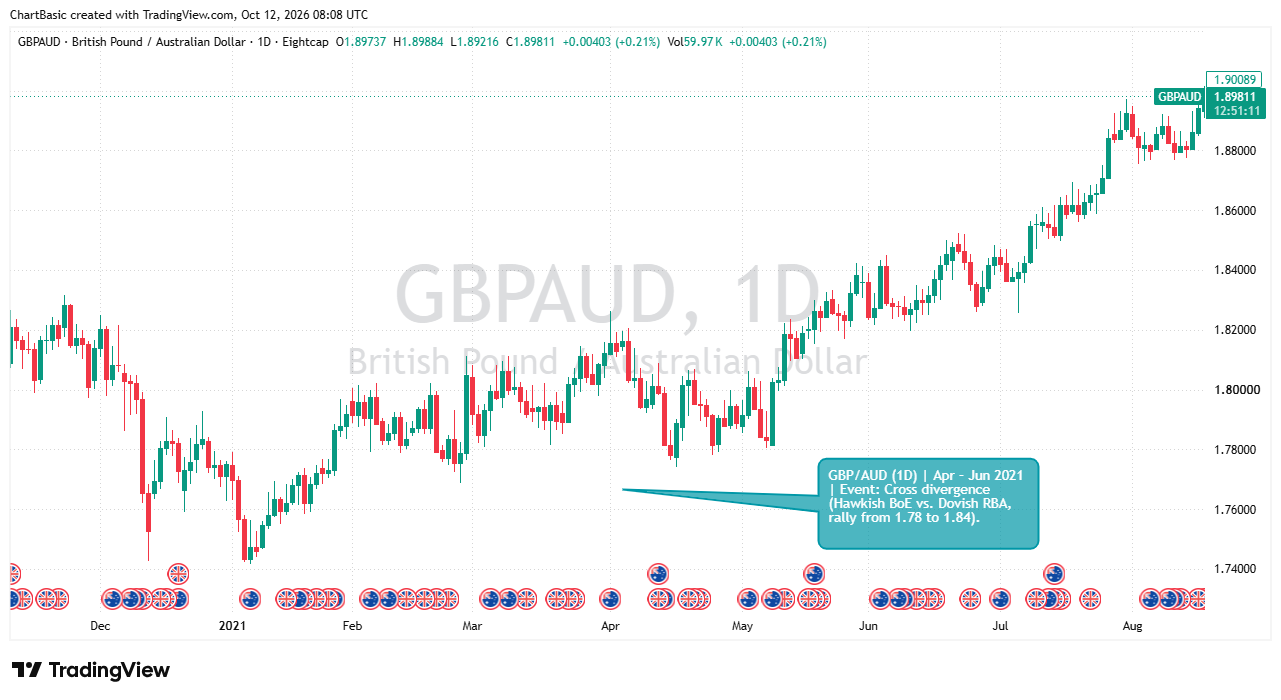
GBP/AUD chart study 09
Chart note · Daily GBP/AUD shows the 2021 cross-policy divergence rally from around 1.78 to 1.84.
Open full chart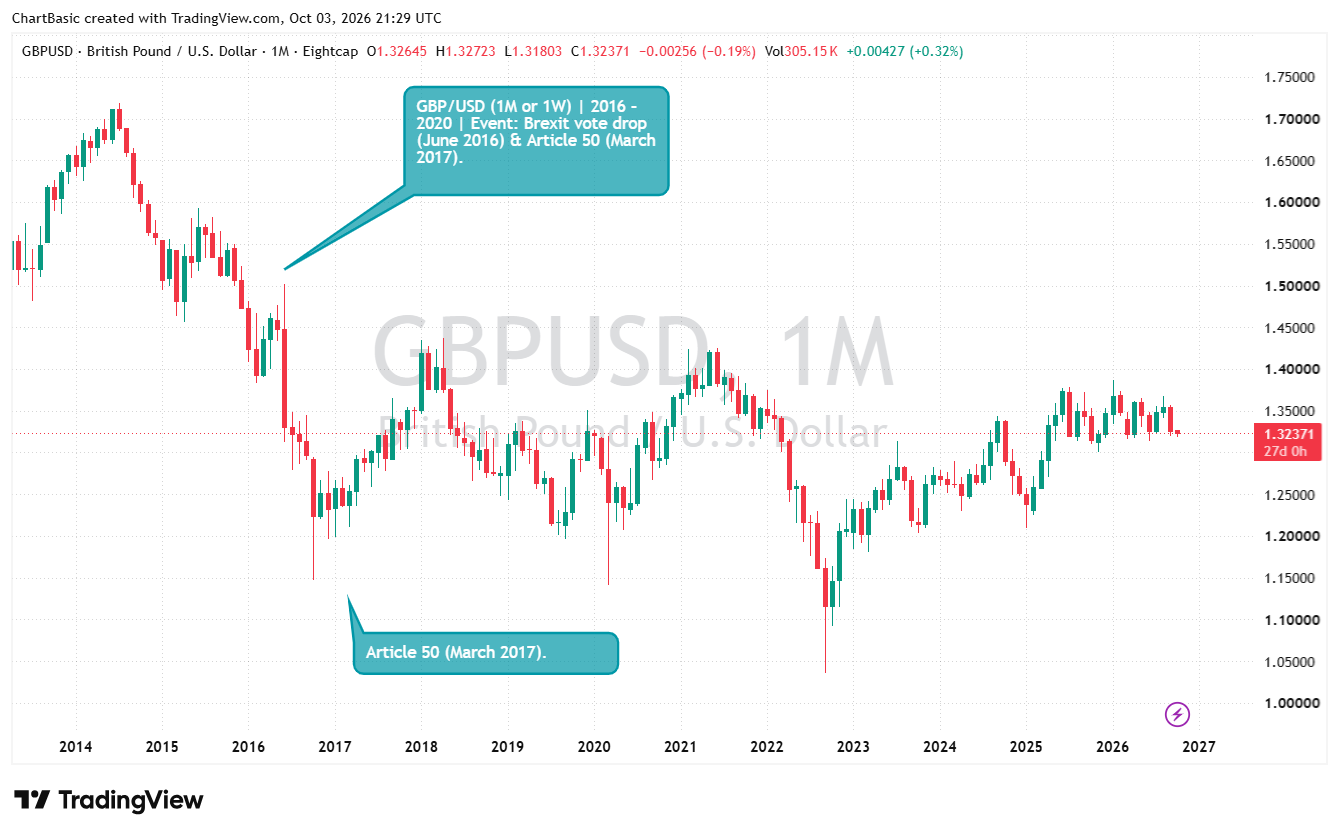
GBP/USD chart study 10
Chart note · Monthly GBP/USD highlights the Brexit referendum selloff and the 2017 Article 50 period.
Open full chart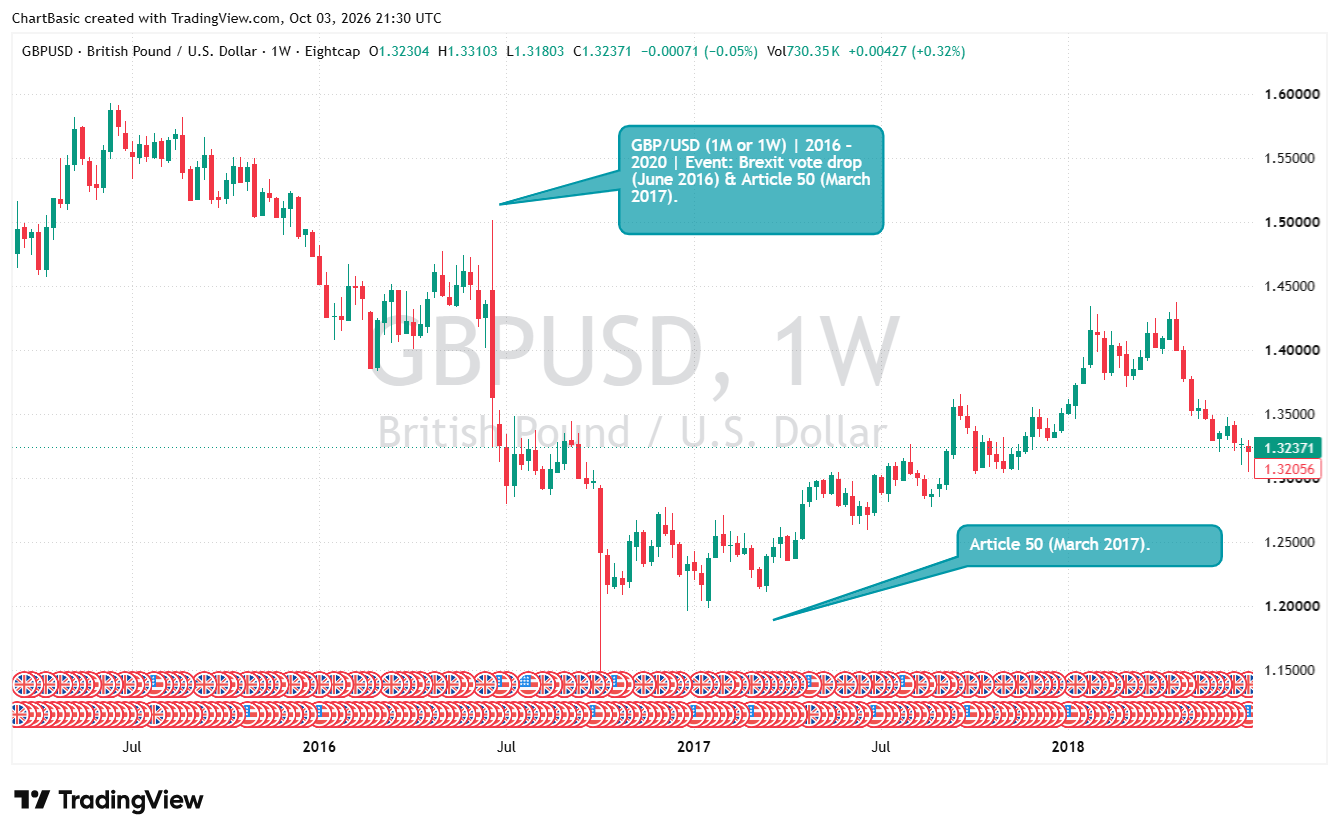
GBP/USD chart study 11
Chart note · Weekly GBP/USD tracks the Brexit vote drop and Article 50-era repricing.
Open full chart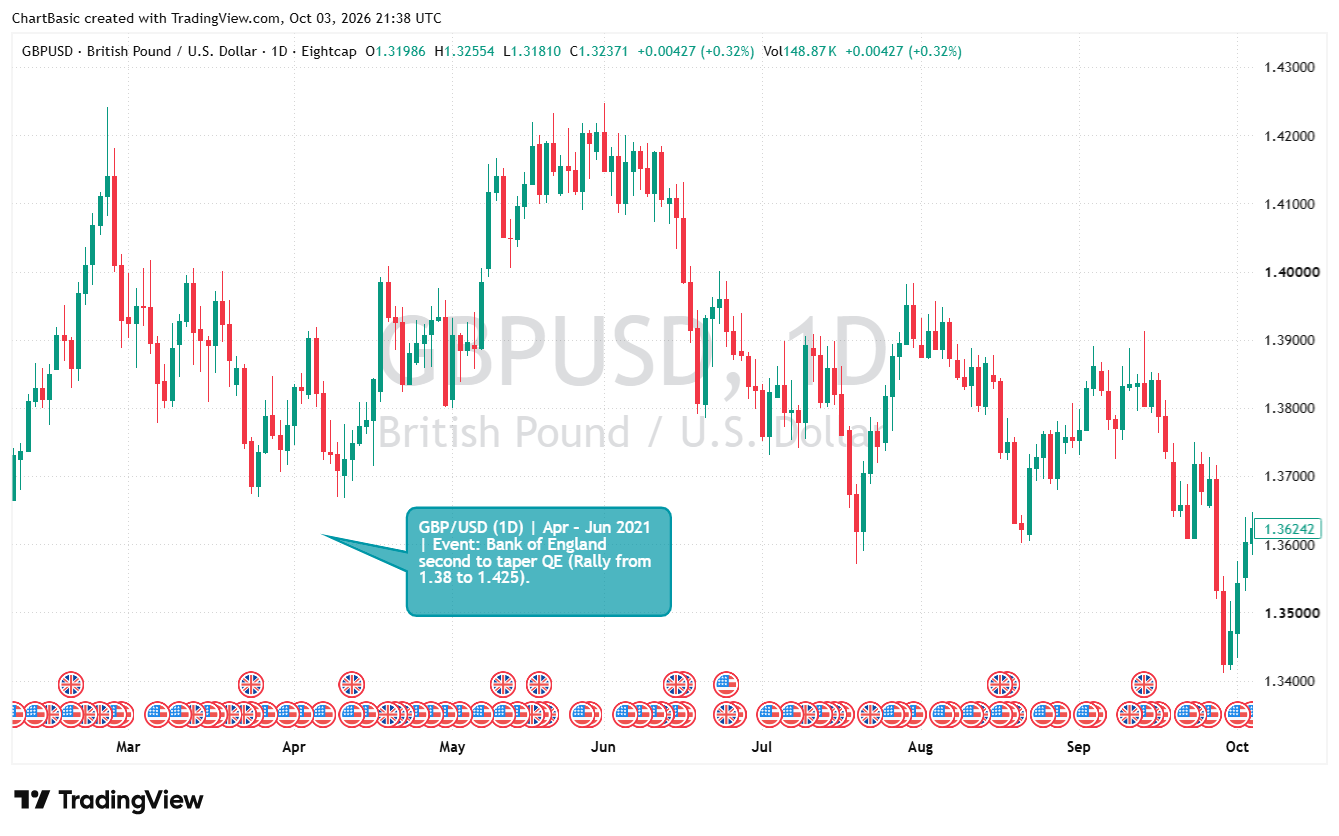
GBP/USD chart study 12
Chart note · Sterling rallied as the Bank of England signaled its second QE taper in spring 2021.
Open full chart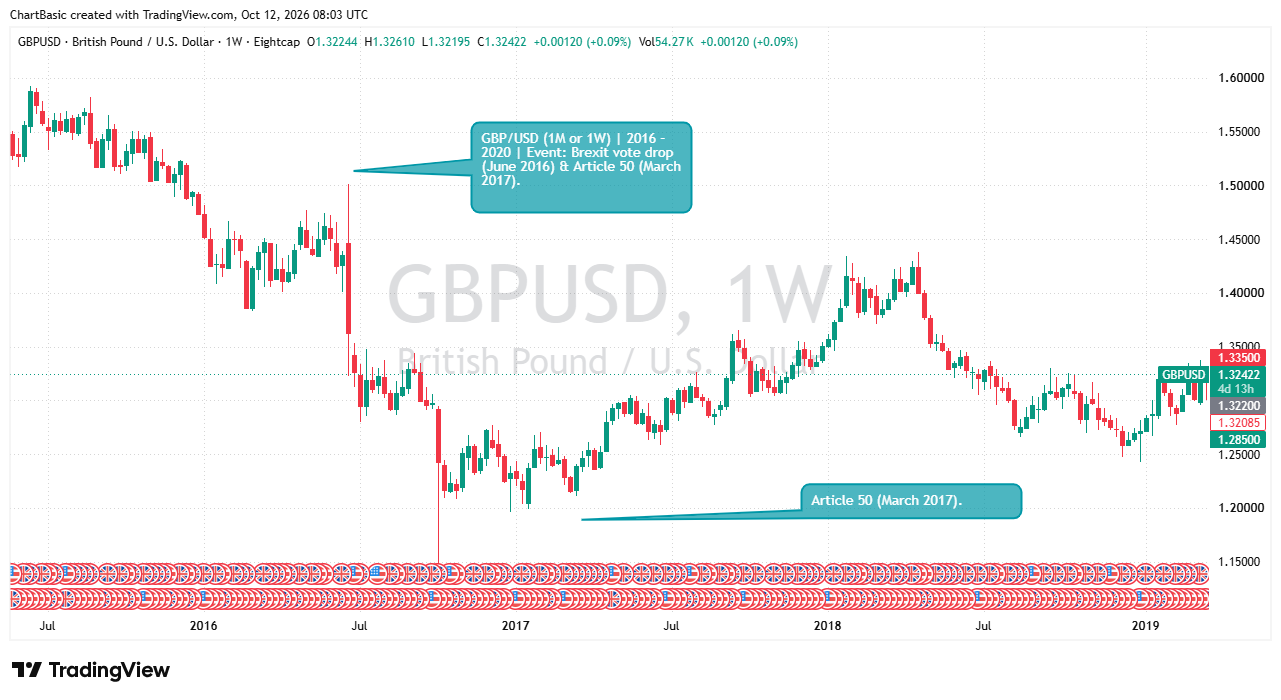
GBP/USD chart study 13
Chart note · Weekly GBP/USD revisits the sharp 2016 Brexit drop and the March 2017 Article 50 trigger.
Open full chart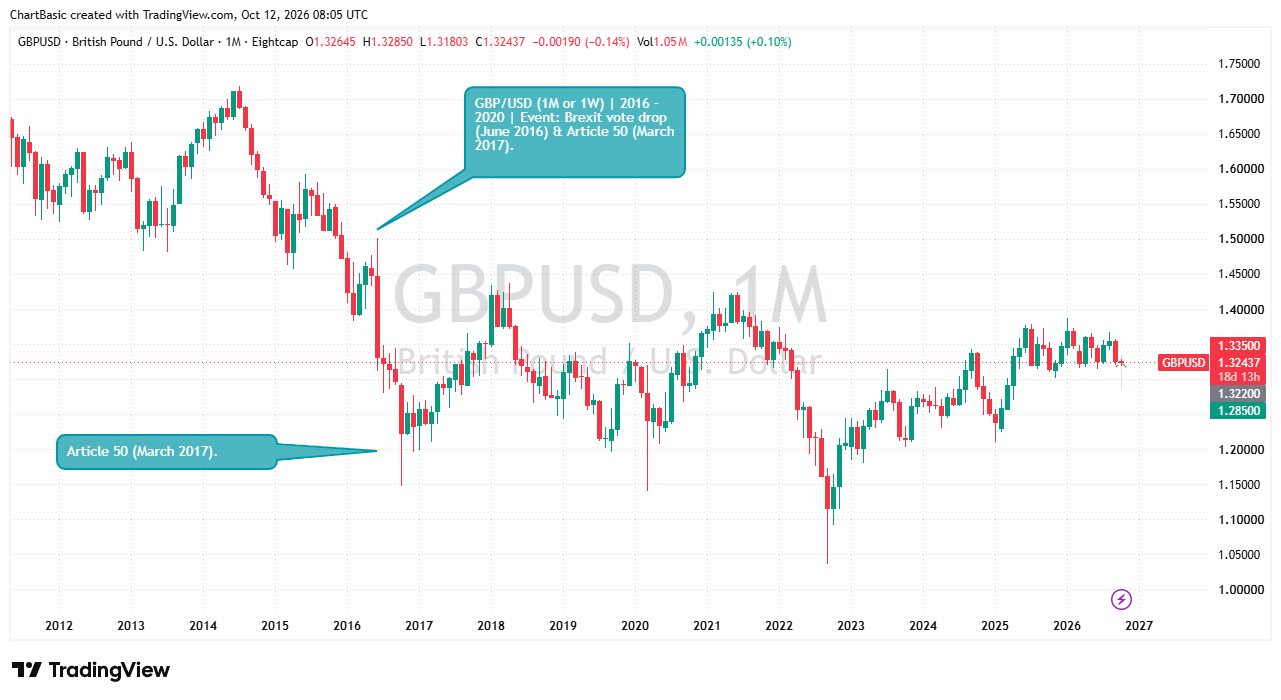
GBP/USD chart study 14
Chart note · The long-term monthly chart places the Brexit referendum and Article 50 within GBP/USD history.
Open full chart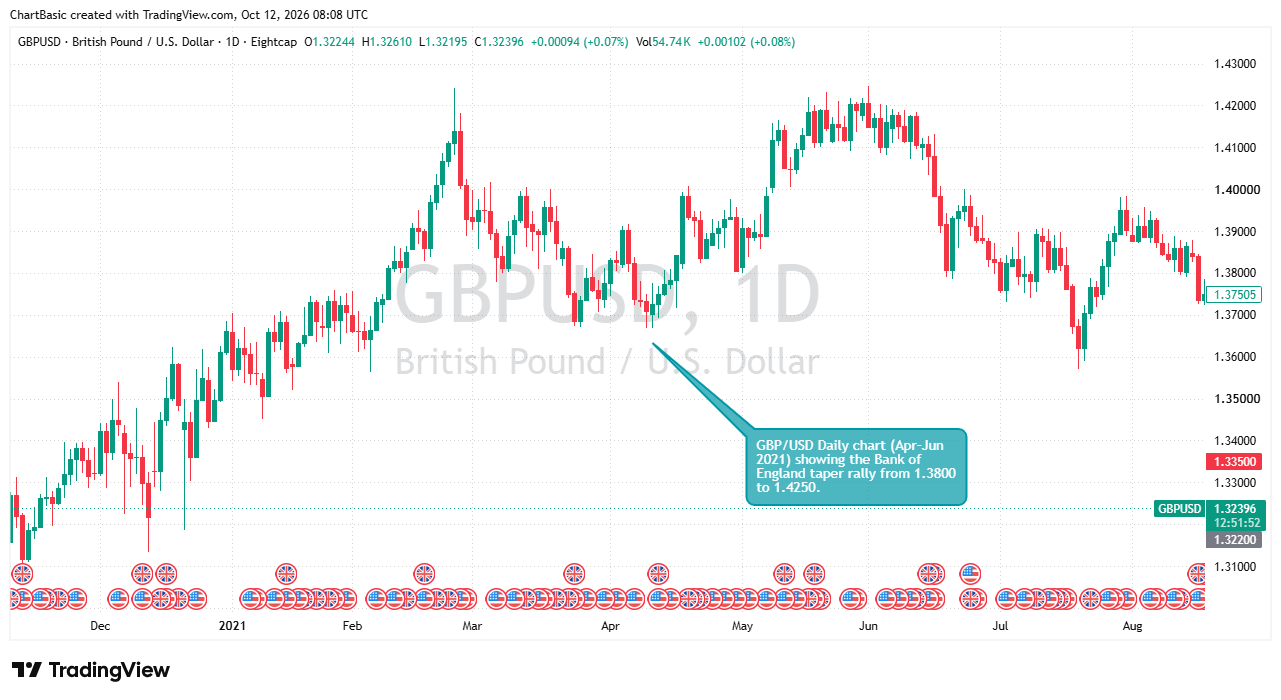
GBP/USD chart study 15
Chart note · Daily GBP/USD shows the spring 2021 rally around the Bank of England’s QE taper signal.
Open full chart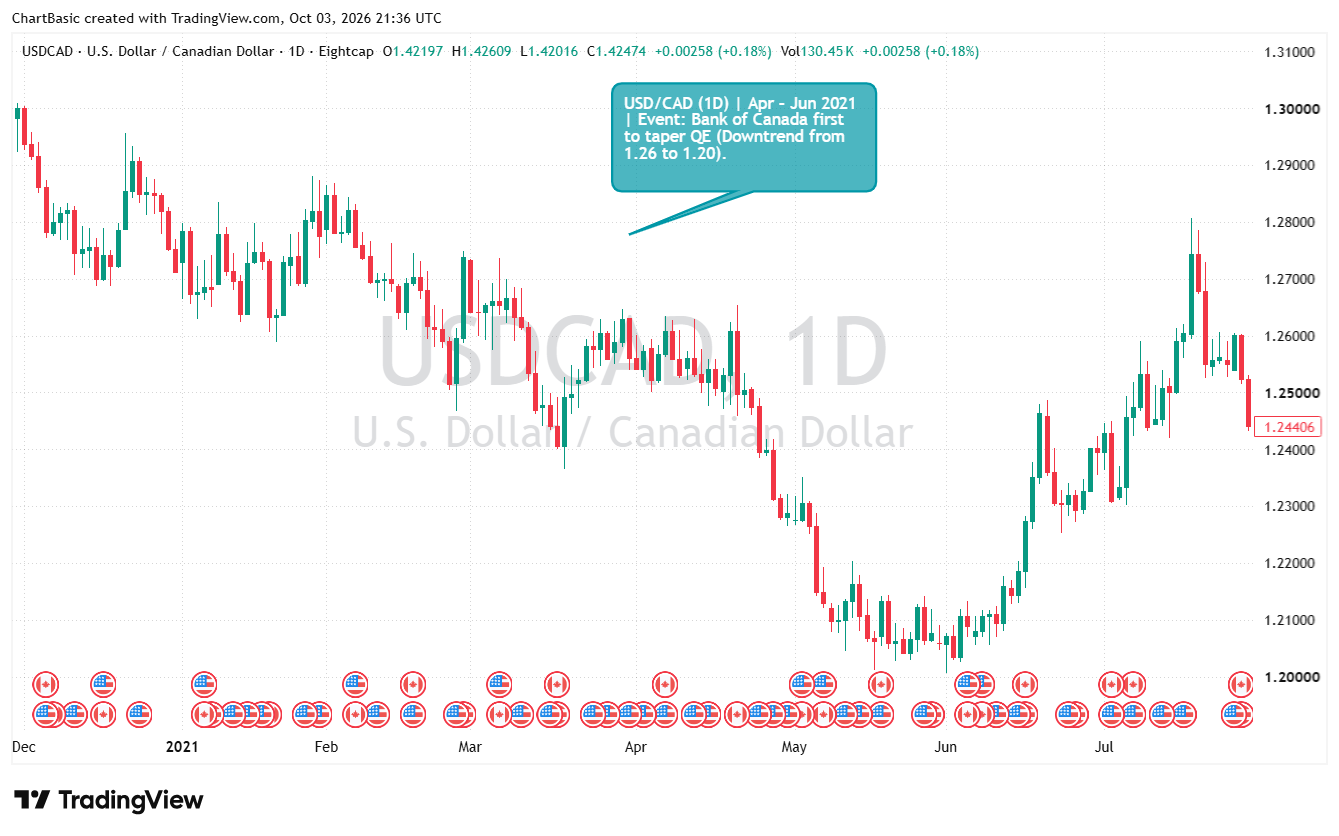
USD/CAD chart study 16
Chart note · USD/CAD fell from about 1.26 to 1.20 after the Bank of Canada’s first QE taper in 2021.
Open full chart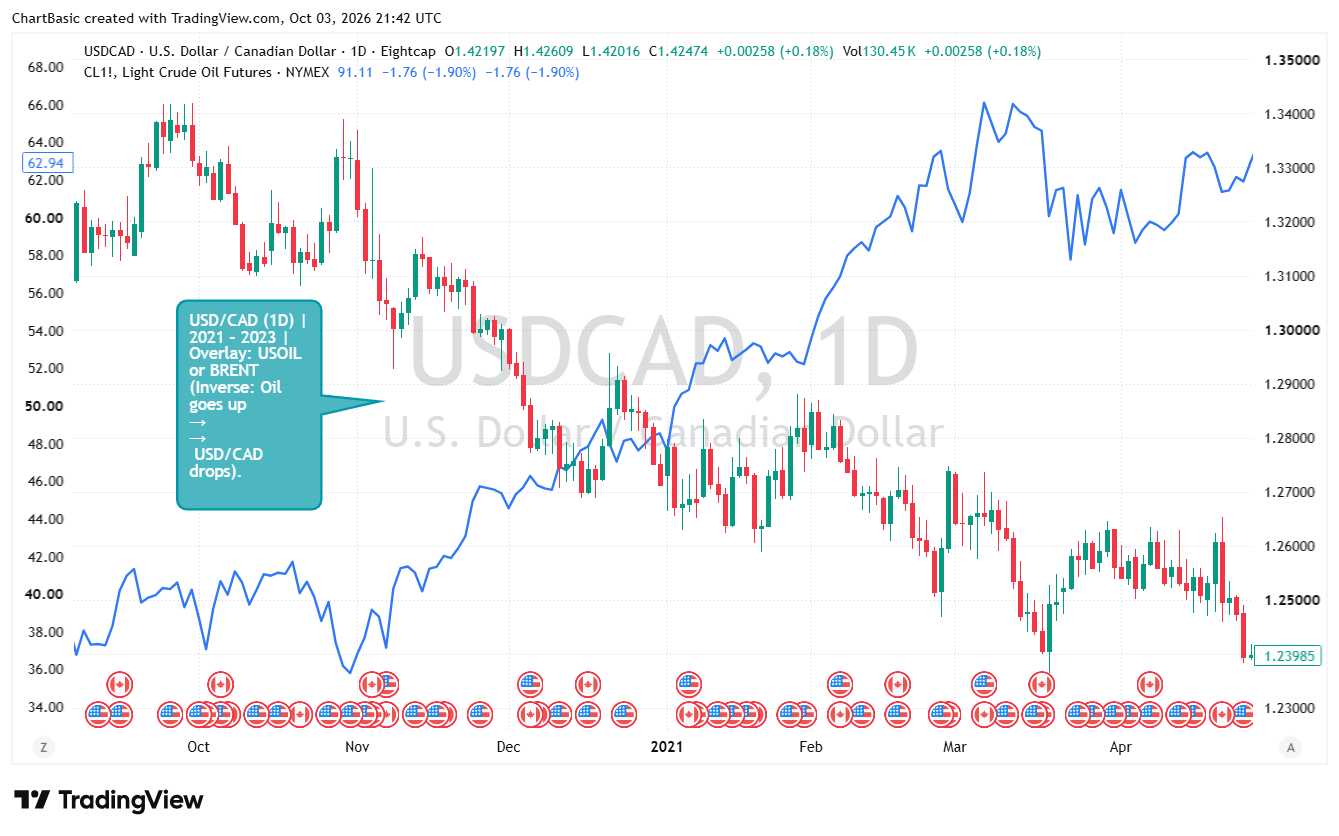
USD/CAD chart study 17
Chart note · A 2021 USD/CAD chart is paired with a crude-oil futures overlay for comparison.
Open full chart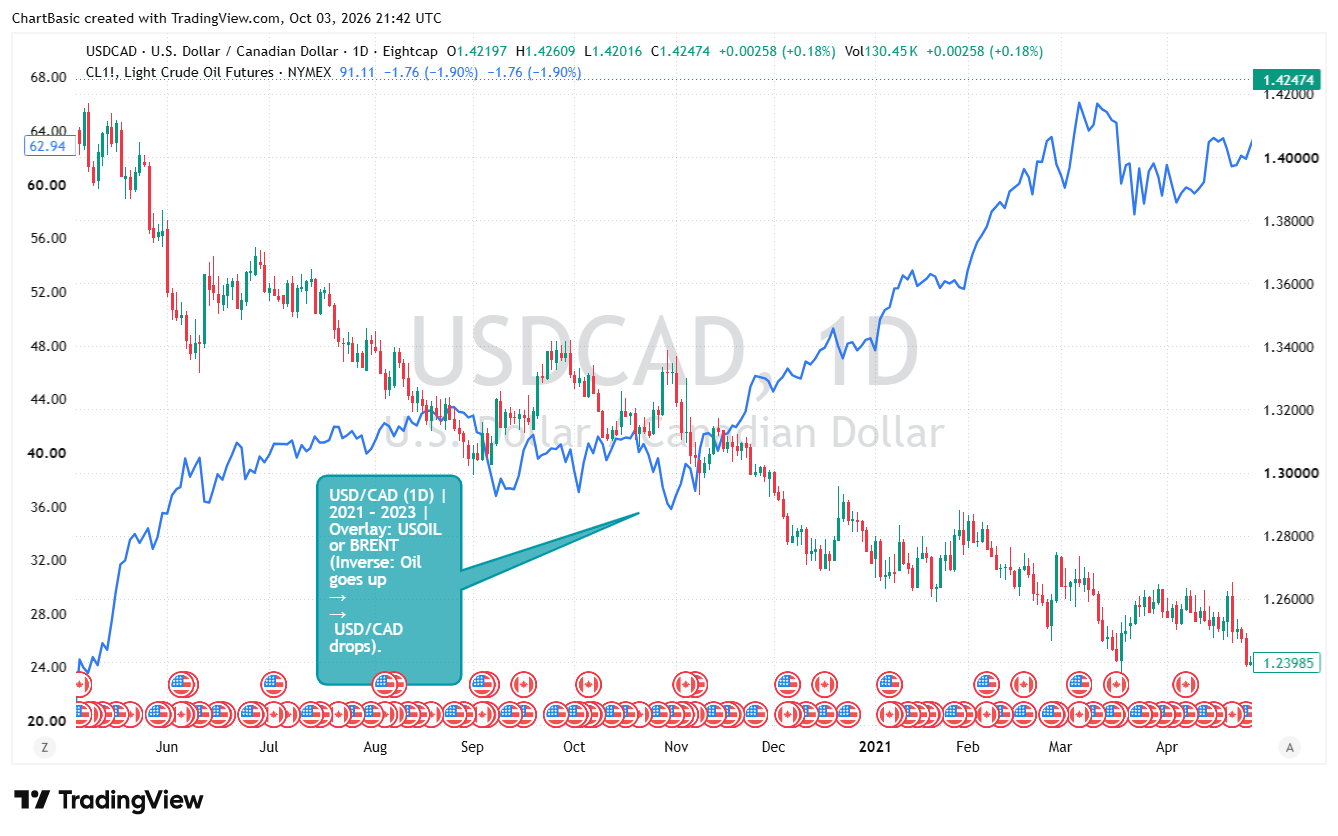
USD/CAD chart study 18
Chart note · Daily USD/CAD traces the 2021 decline, late-spring low, and summer rebound.
Open full chart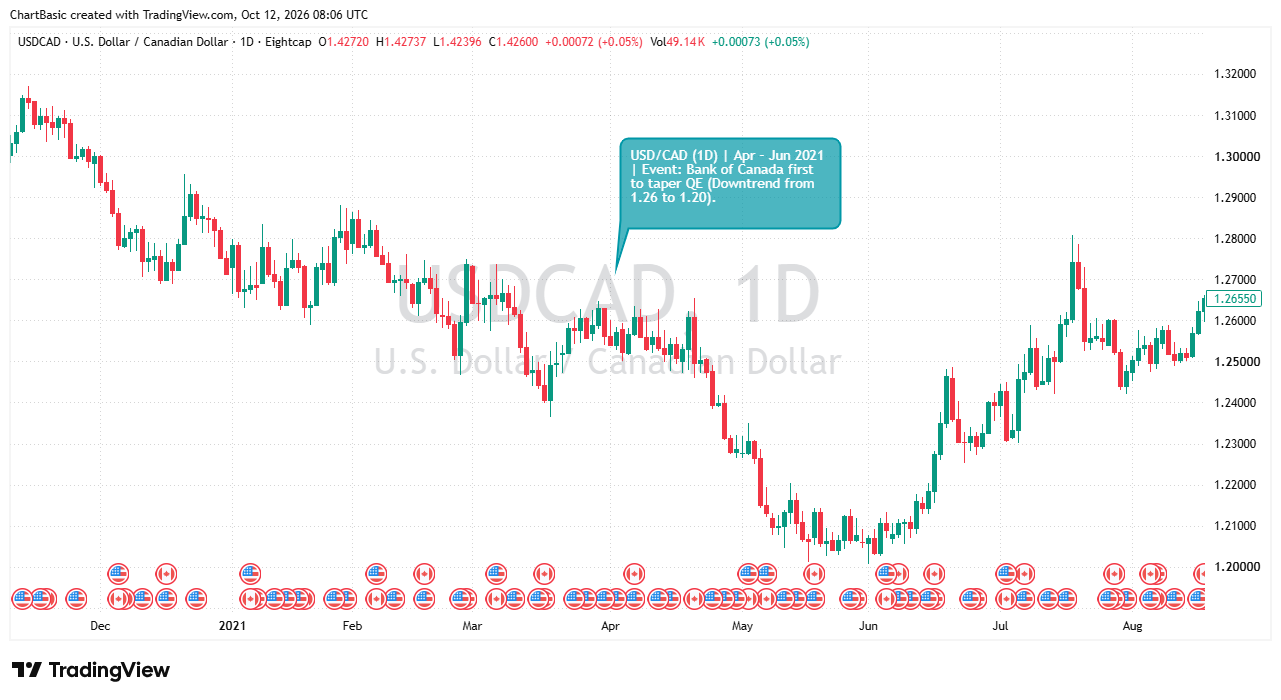
USD/CAD chart study 19
Chart note · The 2021–2023 overlay illustrates the inverse relationship noted between oil and USD/CAD.
Open full chart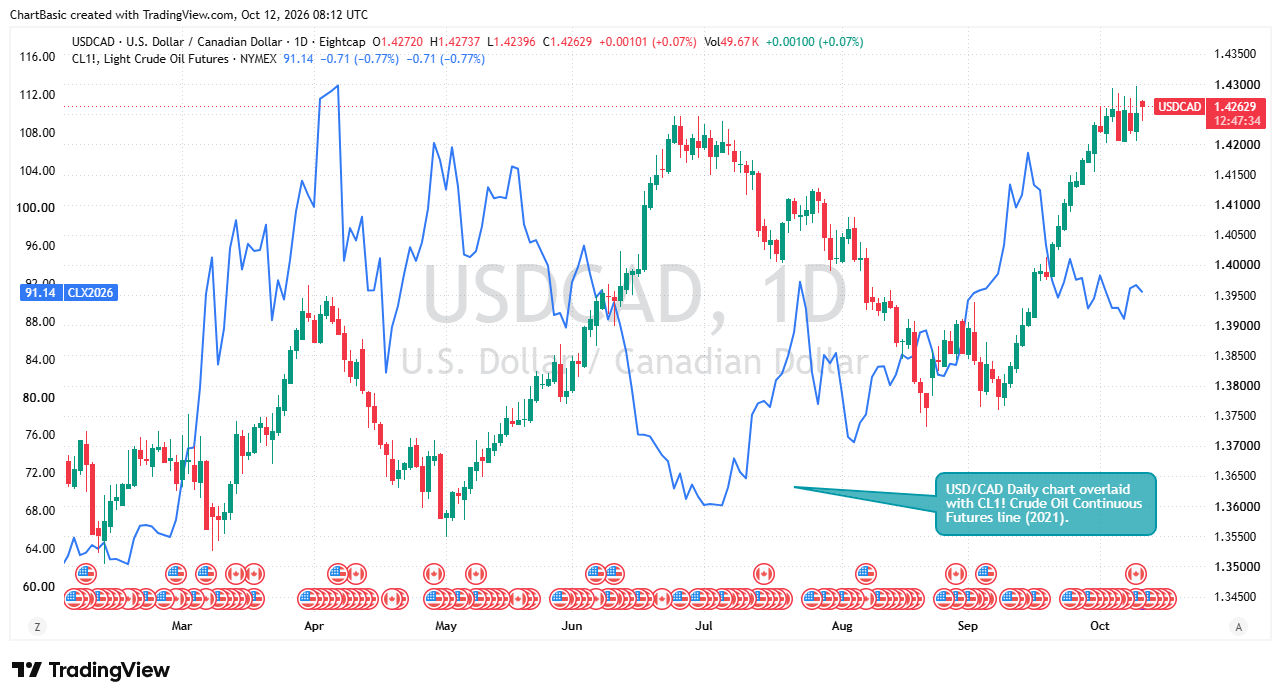
USD/CAD chart study 20
Chart note · Crude-oil futures prices are overlaid with USD/CAD across 2021.
Open full chart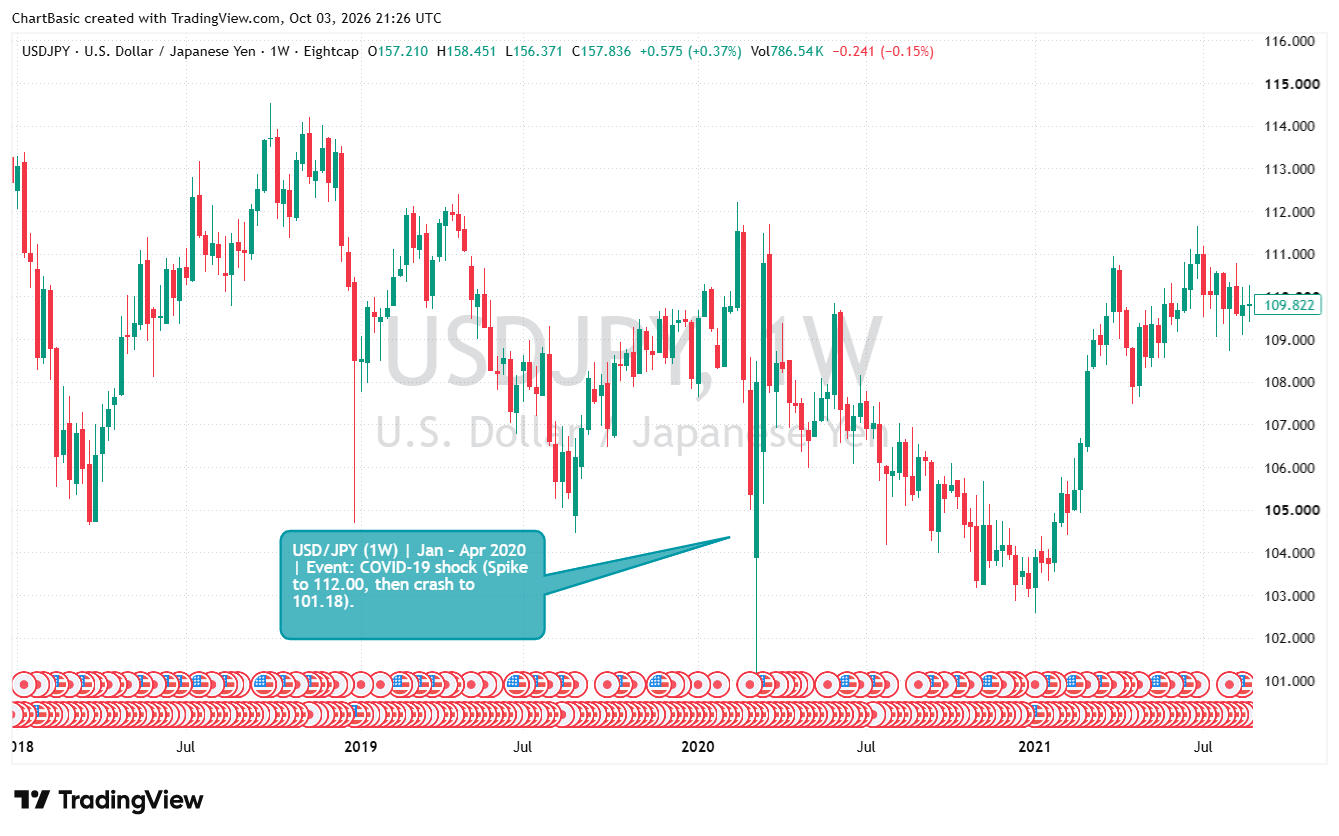
USD/JPY chart study 21
Chart note · Weekly USD/JPY shows the 2020 COVID shock: a spike toward 112 followed by a drop to 101.
Open full chart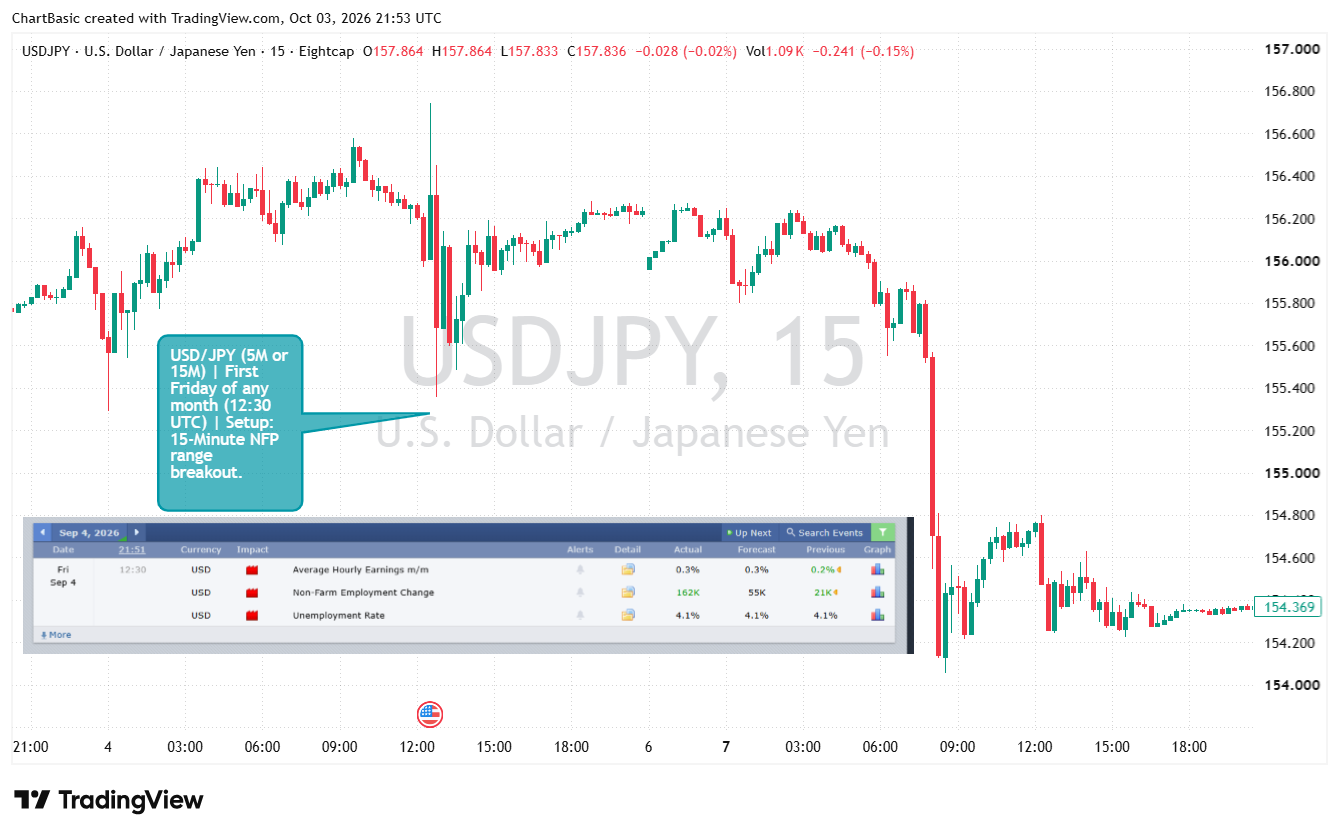
USD/JPY chart study 22
Chart note · A 15-minute USD/JPY chart marks a Non-Farm Payrolls range-breakout setup.
Open full chart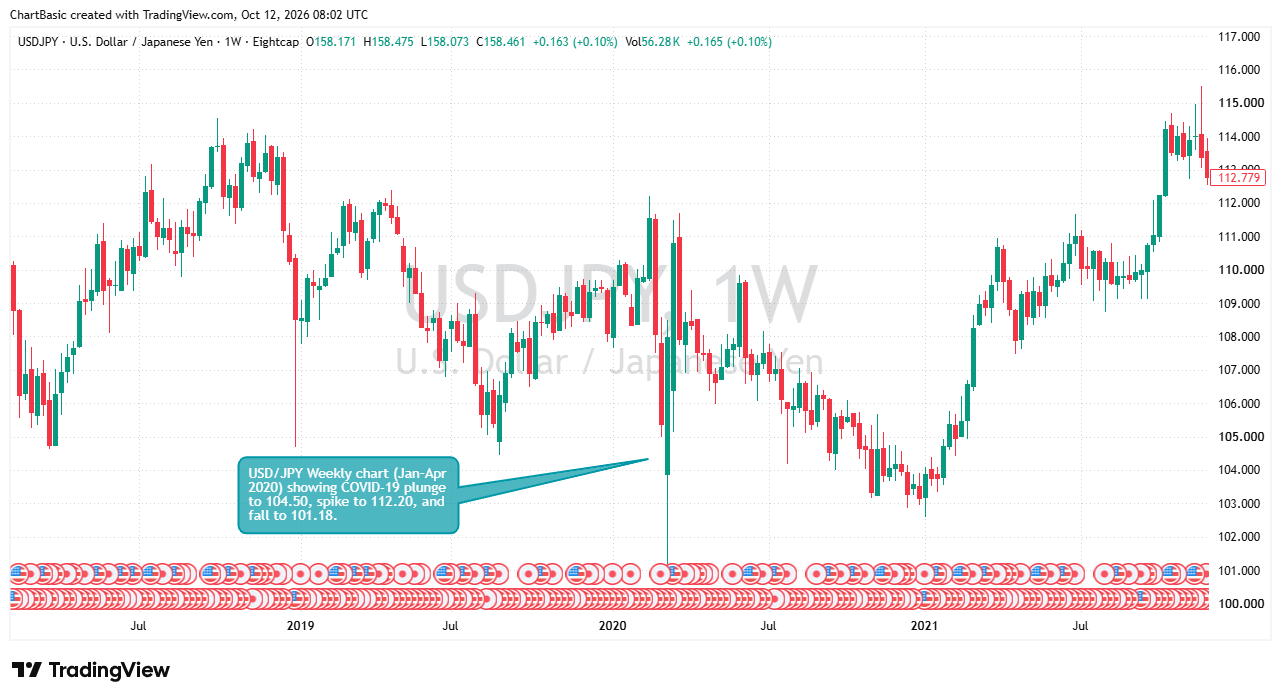
USD/JPY chart study 23
Chart note · Weekly USD/JPY revisits the 2020 pandemic plunge, spike to 112.20, and fall toward 101.18.
Open full chart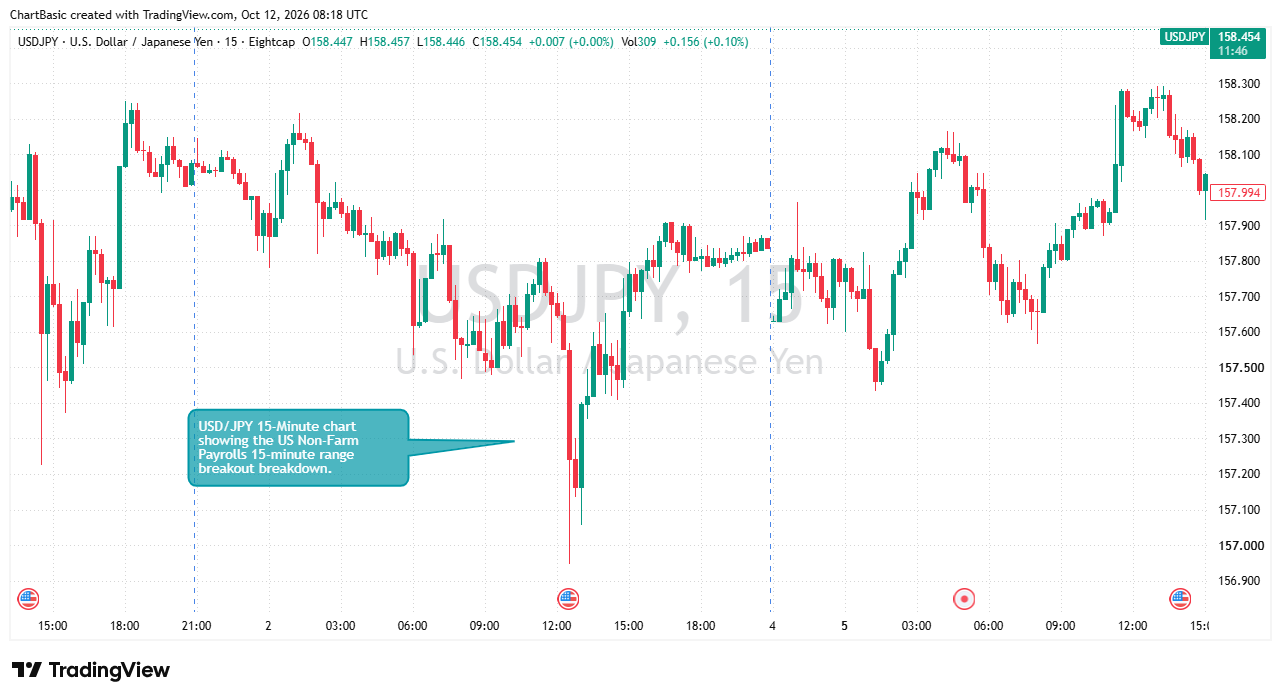
USD/JPY chart study 24
Chart note · This 15-minute chart highlights price breaking down from a marked Non-Farm Payrolls range.
Open full chart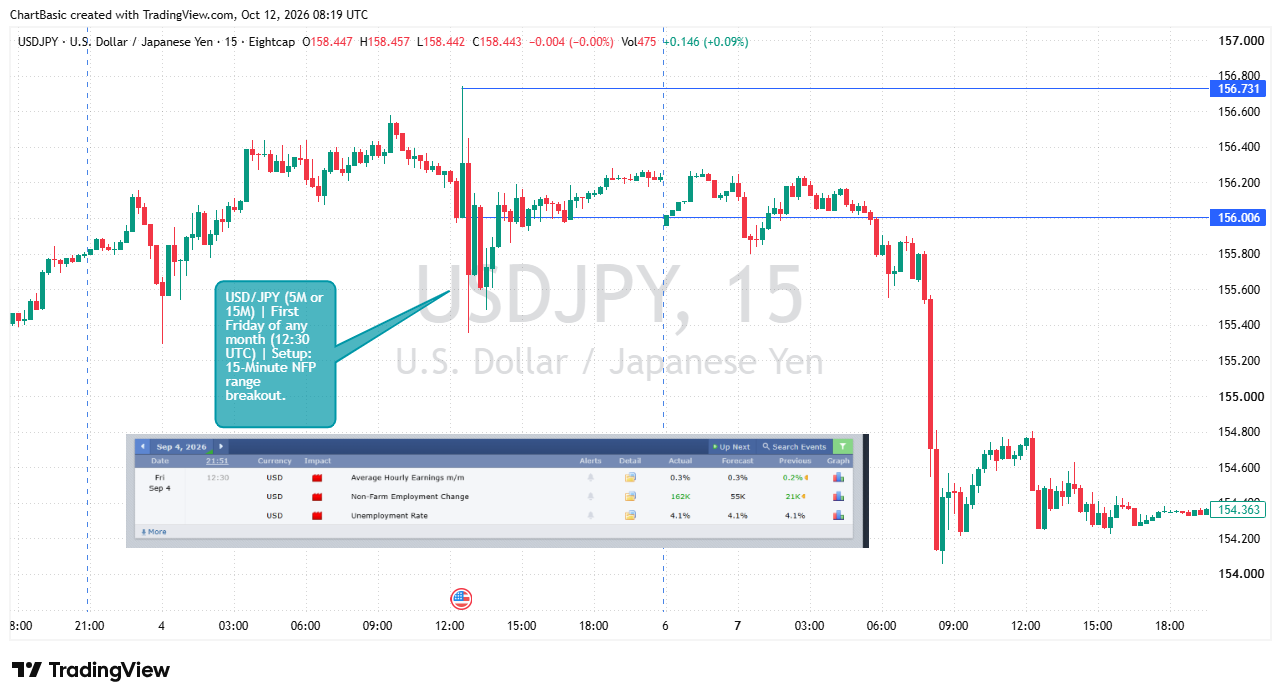
USD/JPY chart study 25
Chart note · A Friday NFP 15-minute range is marked as a potential breakout structure on USD/JPY.
Open full chartHistorical chart screenshots are educational examples, not current market data, forecasts, or trade recommendations. Charts are attributed to TradingView as shown in the supplied images.